|
|
Tsukuba GeneTechnology Laboratories Inc (TGL) |
Phenotypes of organisms, including cancerous states, are the results of information in the genome. The genome information for those are currently investigated using GWAS based on SNP genotyping (DNA level), as well as microarray/real time PCR for gene expression (RNA level).
Lately, since the cost of SNP analysis has declined, 10-times more SNPs than those used a decade ago are being used for genotyping, leading to find more accurate loci responsible for the phenotypes. Concerning the gene expression analysis, with the progress of RNA sequencing technique, the analysis on a specific region of a gene using microarray/real time PCR has shifted to that on all region of the genes, i.e., all transcripts of respective genes (non-targeted analysis).
Tsukuba GeneTechnology Laboratories Inc (TGL) performs SNP genotyping of various species with TGL’s partner companies, and conducts GWAS analysis using the genotyped data to elucidate loci responsible for phenotypes. TGL also provides the results of CLUSTER and STRUCTURE analyses.
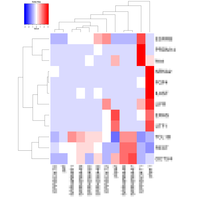
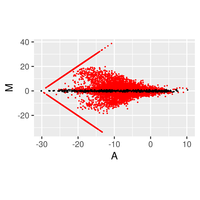
Regarding the gene expression analysis, TGL performs RNA sequencing in the partner company, and conducts analysis of the sequence data with TopHat2/STAR at gene and/or exon level, then with Cufflinks/Cuffdiff, and finally with R-libraries. Through the analysis, we provide Scatter plot, MA plot, Volcano plot, Heatmap, Cluster map, and PCA plot. In addition, we provide expressions of exons in a given gene and spreadsheet including exon sequence for determination of real-time PCR primers.
Very soon, TGL will provide an analysis which elucidates difference of two genomes. For example, alterations of genome through passage of IPS cells will be clarified.
TGL is a venture company derived from University of Tsukuba and National Institute of Agrobiological Sciences and supported by both orgnizations.
Slide Show: Figure Examples
Services
- DNA analysis
- DNA sequencing
- SNP analysis
- Genome variant analysis (in preparation)
- RNA analysis
- RNA sequencing
- Gene/exon expression analysis
- Primer design and RT-PCR
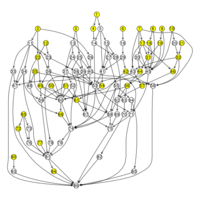
- phylogenetic analysis
- PrintedArrayStirp
- Tissue array
- Labeled cRNA probes for in situ hybridization
Achievement
- Tomohiro Kurokawa, Keisuke Kohno, Kentaro Nagai, Mitsuru Chiba, Sugiru Pak, Soichiro Murata, Kiyoshi Fukunaga, Hiroshi Yasue, Nobuhiro Ohkohchi: Antisense RNA transcripts in the blood may be novel diagnostic markers for colorectal cancer. Oncology letters 07/2017; 14(3)., 10.3892/ol.2017.6572
Contact Us
Please feel free to ask us for further details.
Examples of analysis service
DNA analysis
- DNA sequencing
- DNA sequencing is conducted in our partner company; this is done with 150bp pair-end sequencing.
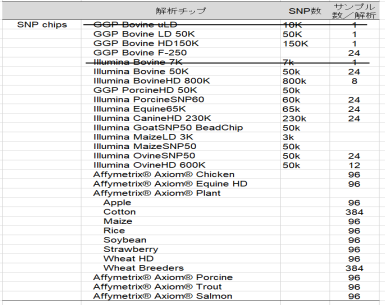
- SNP analysis
- SNP genotyping is provided for customers in Japan.

RNA analysis
- RNA Sequencing
- RNA sequencing is conducted in our partner company, when we get samples. Depending on species, polyA+RNA and/or RiboZero RNA are target of sequencing. As our standard, 40million reads are provided with 100bp or 150bp pair-end sequencing.
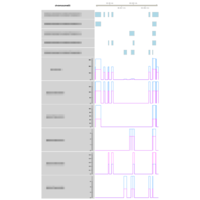
- Expression Analysis at gene and/or exon level
- RNA sequence reads are first subjected to TopHat2 or STAR (at your choice) for mapping them to the latest reference genome, and aligned by Cufflinks. The resulting data are analyzed with Cuffdiff then with R libraries. Lately, to obtain more concrete information about gene expression, in addition to in silico data, ‘wet examination’ is prerequisite using real-time PCR. We provide primer sequence information for the real-time PCR.
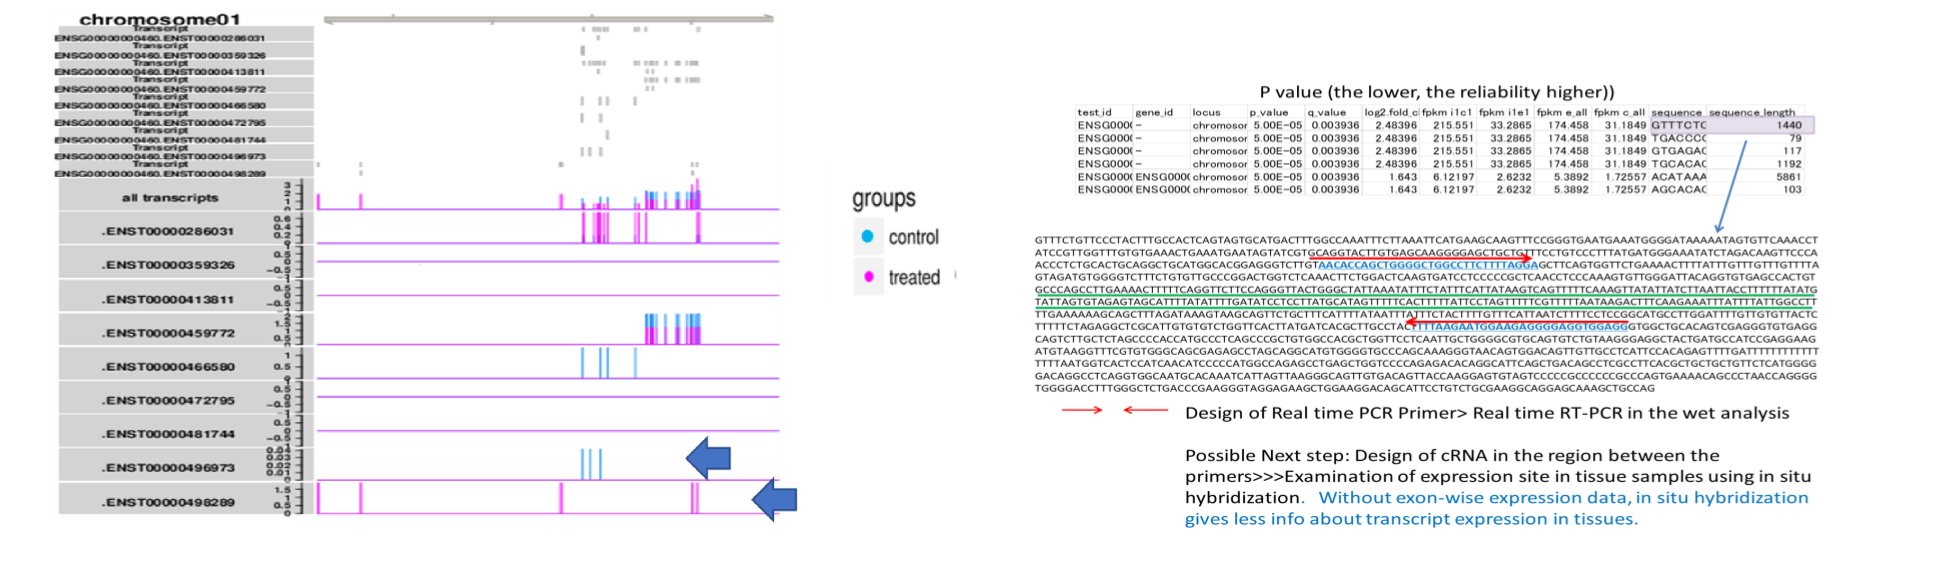
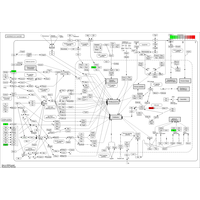
Synthesis of cRNA probe for in situ hybridization
Currently, a sequence region suitable for in situ hybridization probe is quested in the open-reading frame or 3’UTR, and determined appropriately. However, transcriptome analysis based on RNA sequencing has revealed that various levels of exon expression are generated in a given gene.
Therefore, in order to obtain a significant result in in situ hybridization, the determination of the probe region is of utmost importance. We propose the candidate regions for probe(underlined with green), based on the customer’s thought.
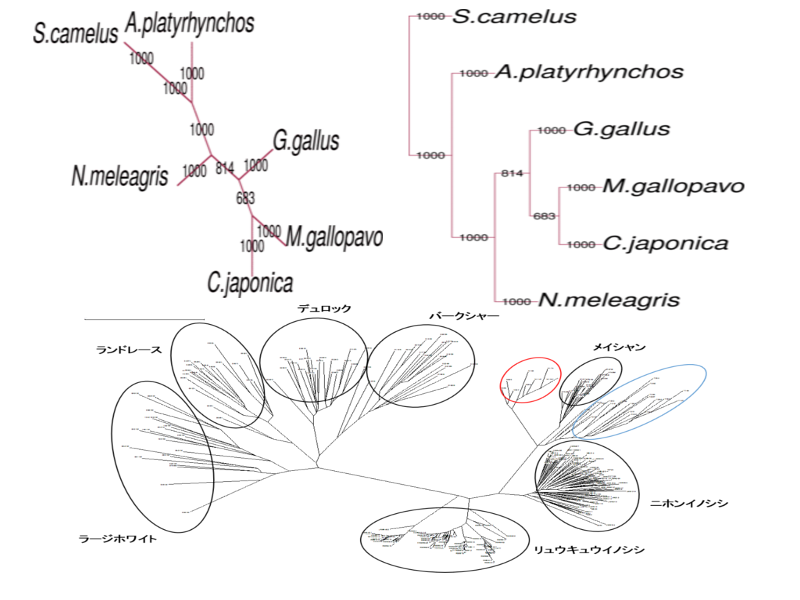
phylogenetic analysis
Not only nucleotide and amino acid sequence, phenotype data (e.g. morphology) can be used for phylogenetic analysis.
For phylogenic tree construction, distance matrix method, maximum parsimony method, maximum likelihood method, and Baysian method have widely been used. We support all of these methods.